IDE Debug Guide
For IDE environment installation, please refer to IDE Compilation Environment。
Eclipse Debugging
First, plug the cklink debugger into your computer, then install the cklink driver.
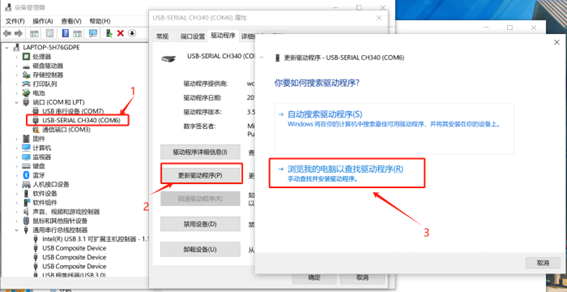
Right-click and then click on Change Driver. After that, you need to manually change the driver.
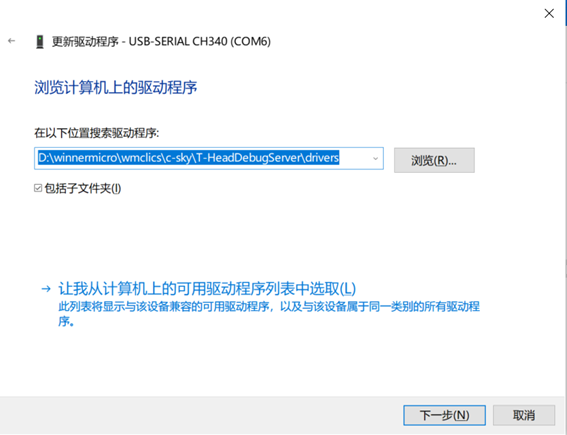
The driver needs to be searched according to the following path:
Custom Disk\wmclics\c-sky\T-HeadDebugServer\drivers
After configuring the driver, open Eclipse, and find the Debug function in the top toolbar.
Click on the triangle symbol next to it and find Debug Configurations.
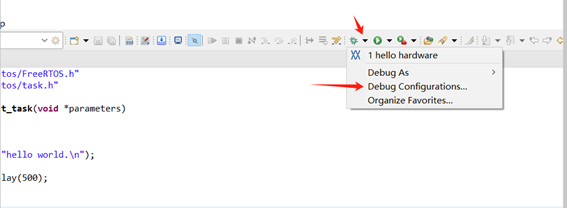
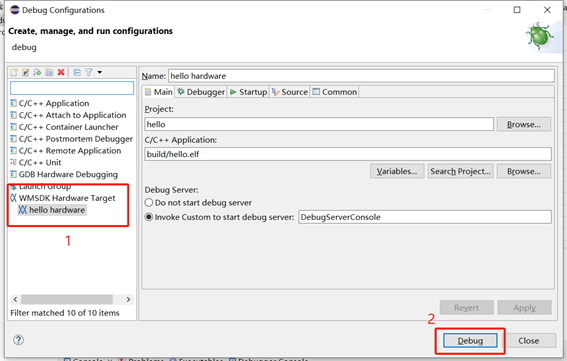
Double-click on WM IOT SDK Hardware Target to create a debug target, then click the Debug button to start debugging.
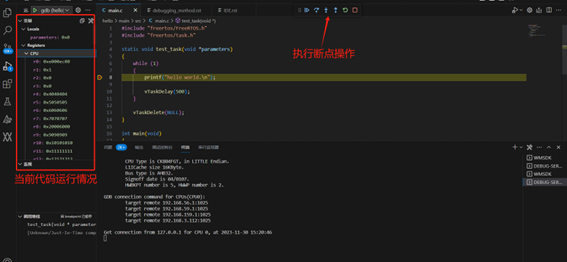
VS Code Debugging
After connecting the cklink debugger, open VS Code.
Right-click on the project file and select the Debug command to start debugging.
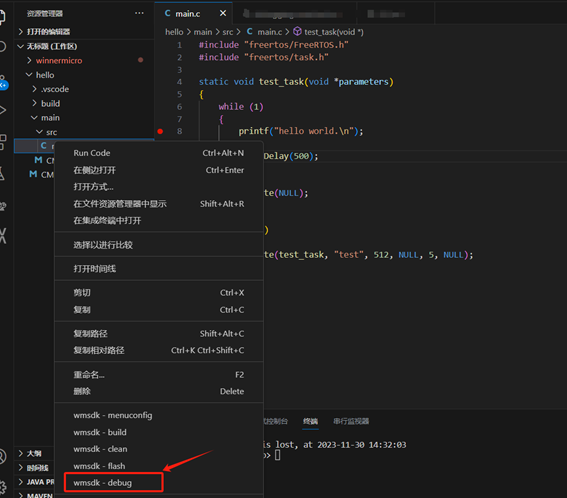
You can also select the Debug command from the WM IOT SDK tool in the bottom status bar to start debugging.
Using VS Code for breakpoint debugging is shown in the following figure: